


A Search Console traffic drop becomes manageable once you read four things in order: the date range, the clicks-versus-impressions pattern, which pages and queries lost the most, and whether the loss is site-wide. Each step takes a few minutes in the Performance report, and each one rules something in or out.
This guide walks through the steps and explains what common patterns may suggest, without treating any of them as proof. It builds on our guide to Google core update recovery and focuses on reading the data itself. You need nothing beyond access to your own Search Console property.
Key Takeaways
- A Search Console traffic drop is easiest to read when you set the date range to 16 months first, so you can see whether the same dip happens every year
- The relationship between clicks and impressions is the fastest clue: both falling points to fewer appearances, while steady impressions with fewer clicks points to what searchers see and choose
- Comparing equal periods, and sorting the results by the difference, shows which pages and queries lost the most
- Splitting branded searches (your business name) from non-branded searches shows whether you lost visibility with people who did not already know you
- Average position is a blunt number, and Google’s debugging guide says not to focus too much on absolute position, since impressions and clicks are the measure of success
- Filtered totals will not match the chart exactly, so judge direction and size, not the last digit
Reading a Search Console Traffic Drop: What the Performance Report Measures
Open the Performance report for Search results. According to Google’s overview, the default view shows clicks and impressions for the past three months, and you can change the metrics, dimensions, and dates from there.
| Metric | What Google says it is | A reading trap |
|---|---|---|
| Clicks | The number of times a user clicked your site from Google Search results | Clicks can fall because demand fell, not because you lost ground |
| Impressions | How many times your site appeared in Search results | More impressions are not always better, since they can come from broader, lower-intent searches |
| CTR | Clicks divided by impressions | CTR can drop when impressions rise for searches that were never going to convert |
| Average position | The average position of the topmost result from your site | One average can hide big movement on a few important searches |
Two other details matter. The newest data can be preliminary and may change within hours, which the chart shows as a dotted line. And the chart is aggregated by property, while the table is aggregated by dimension, so the two can differ slightly.
Step 1: Set the Date Range So Seasonality Shows
Choose the date filter and select the last 16 months. Google’s debugging guide recommends this so you can tell whether a drop happens every year because of a festivity or a trend.
Then switch the time granularity to weekly or monthly. Google notes that weekly and monthly views smooth out daily swings like weekends and holidays, which makes long-term direction easier to see.
For example, a Hartford HVAC company might see searches swing with the seasons. In the 16-month view, that pattern appears as two similar shapes a year apart, and the “drop” turns out to be the calendar.
Step 2: Compare Equal Periods
Open the date filter, choose the Compare tab, and pick either the previous period or the same period last year. When you compare two values, the table adds a Difference column, and you can have only one comparison at a time.
Keep the two periods the same length and avoid comparing a holiday week with an ordinary one. If you are checking a suspected core update, use Google’s approach: confirm the update has finished, wait a full week, and compare that week with the week before the update started.
Step 3: Read the Pattern in Clicks and Impressions
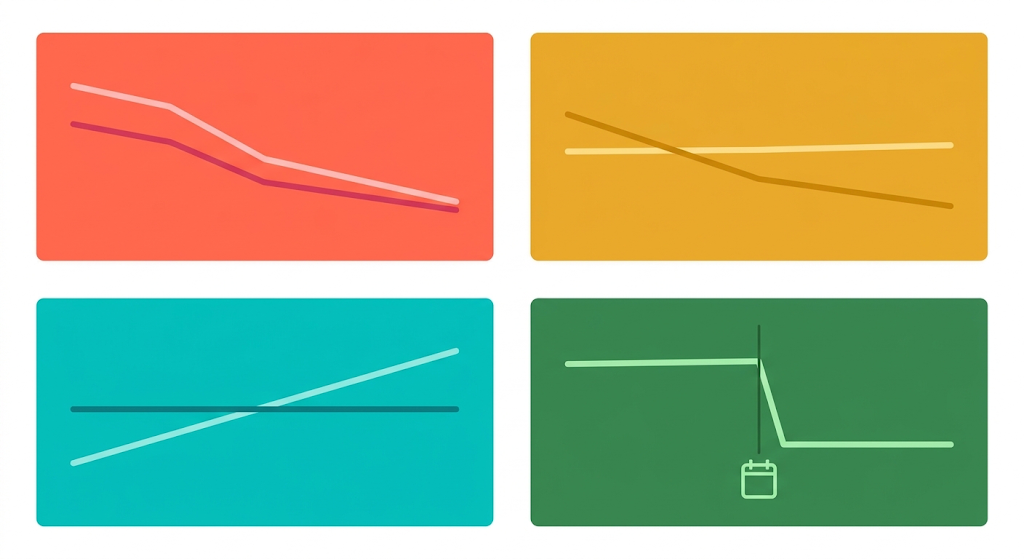
Turn on clicks and impressions together and look at how the two lines moved. The combination is the fastest clue you have.
| Pattern in the chart | What it may suggest | Next check |
|---|---|---|
| Clicks and impressions both fell | Your site appeared less often, which can come from ranking changes, indexing problems, seasonality, or shifting demand | The 16-month view, the Page indexing report, and Google Trends |
| Impressions steady, clicks fell | Searchers saw you but chose differently, since Google points to page titles, snippets, or a competitor’s more appealing result | Queries sorted by CTR, and your titles and descriptions |
| Impressions rose, clicks flat | You may now appear for broader, lower-intent searches | The queries list for new, vague terms |
| Position fell, impressions steady | You moved down for similar searches | The comparison table for the affected queries |
| A drop starting on one exact date | Something changed around that date | Your site change log, plus the Security Issues and Manual Actions reports |
A New Haven dental practice, for instance, might see steady impressions and fewer clicks. That points the review toward how its listings read in results, not toward a hunt for technical faults. A page can also lose clicks when Google answers a question directly in the results, which our guide to Google AI Mode covers.
Step 4: Find Where the Loss Came From
Now switch to the Pages and Queries tabs with your comparison still on. Sort by the clicks difference so the biggest losers rise to the top, as Google’s guide suggests.
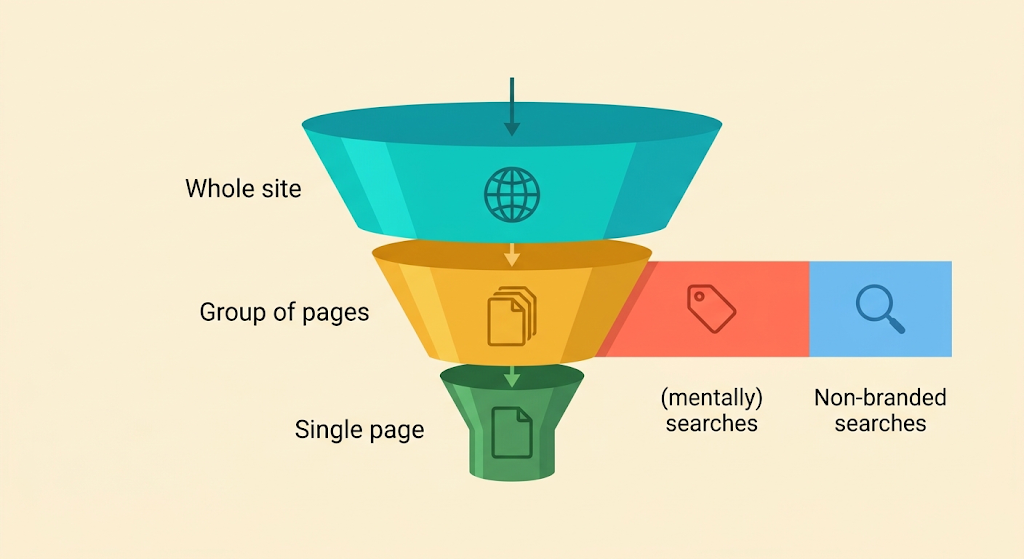
Then ask one question: is the loss spread across the whole site, concentrated in a group of pages, or sitting on one important page? You can test a group by adding a page filter set to “URLs containing” a shared folder, such as your service pages or your location pages.
- Site-wide loss: check the Page indexing report
- A group of pages: use URL Inspection on a few of them
- One page: look at that page’s content, title, and any recent edits
A Guilford contractor who redesigned the website might find that only the old service URLs lost traffic. That points toward redirects and indexing, so a migration review is the next step, and our guide to website migration SEO risks explains what to look for.
Step 5: Split Branded and Non-Branded Searches
Add a query filter set to “Queries containing” your business name, and note the totals. Then switch the filter to “Queries not containing” the same name and note those totals. The advanced filtering options also support regular expressions if you need to match several spellings.
The two numbers tell different stories. Branded searches come from people who already know you, so they tend to reflect word of mouth, advertising, and reviews. Non-branded searches show how often strangers find you when they are looking for the service.
A Stamford law firm might find that branded clicks held steady while non-branded clicks fell. That would suggest the firm lost visibility with new prospects, not that existing clients stopped looking for it.
One caution from Google: filtering by query can change report totals, because of data truncation and the omission of anonymized queries. Treat the split as a direction, not an exact count.
Step 6: Check Devices and Search Types
Open the Devices tab and compare mobile with desktop, using the same comparison dates. Then use the search type filter to look at web, image, video, and news results separately, since a drop in one can hide inside the total.
A Bridgeport home services company might find that desktop clicks held while mobile clicks fell. A mobile-only decline is a good reason to open the site on a phone and check that forms, buttons, and pages still work.
Step 7: Rule Out Technical, Security, and Manual Action Causes
Before you blame an update, check the reports that Google’s debugging guide points to. The Page indexing and Crawl stats reports show technical problems, the Security Issues report shows threats like malware, and the Manual Actions report shows whether Google applied one to your site.
These reports are often empty, which is the point: a quick check rules them out for certain instead of by assumption. Our guide to Google core update recovery covers the full list of causes and what to do about each.
Common Reading Mistakes
- Trusting average position alone. Google’s debugging guide says not to focus too much on absolute position.
- Comparing unequal periods. A 28-day window against a 31-day one, or a holiday week against a normal week, creates differences that are not real.
- Treating preliminary data as final. The dotted line on the chart means the newest numbers can still change.
- Expecting filtered totals to match the chart. Filters omit anonymized queries, and chart and table totals use different aggregation.
- Using the daily view for long-term direction. Daily data is useful for spotting spikes, while weekly and monthly views show the trend.
- Changing the site before the comparison is done. If you edit pages mid-analysis, you can no longer tell what moved the numbers.
A 30-Minute Worksheet
Work through the steps once, in order, and write down what you see. A written record is useful if you later bring in a consultant, and it stops you from re-doing the work.
| Step | Setting to use | What to write down |
|---|---|---|
| 1. Seasonality | Last 16 months, weekly view | Whether the same dip appears a year earlier |
| 2. Equal periods | Compare, previous period or year over year | The size of the change in clicks and impressions |
| 3. Pattern | Clicks and impressions together | Which pattern from the table matches |
| 4. Where | Pages and Queries, sorted by clicks difference | Site-wide, a group of pages, or one page |
| 5. Brand split | Queries containing, then not containing, your name | Whether the loss is branded or non-branded |
| 6. Device and type | Devices tab, search type filter | Whether one device or search type fell |
| 7. Rule-outs | Page indexing, Security Issues, Manual Actions | Anything flagged, or “clear” |
When to Get a Second Opinion
Most of this takes an afternoon and costs nothing. A second opinion is worth considering when:
- The drop is large and site-wide, and none of the steps above explains it
- A redesign, platform change, or URL change happened shortly before the drop
- Search Console shows a manual action or a security issue
- You serve several Connecticut towns and cannot tell which pages lost ground
FAQs
How do I check in Google Search Console traffic drop?
Open the Performance report, set the date range to 16 months, and compare the drop period with an equal earlier period. Then read the clicks and impressions pattern, sort pages and queries by the difference, and rule out indexing, security, and manual action issues. The worksheet above puts the steps in order.
Why are my impressions the same but my clicks down?
Google says this can mean your page title and snippet are not clearly showing searchers what the page covers, or that another site had a more appealing result. Review the queries that lost clicks, sort by CTR, and compare how your listing reads with the ones above it.
What date range should I use to check a traffic drop?
Start with the last 16 months, so you can see whether the same dip appears every year. Then compare equal periods, such as the last three months against the previous period or the same months last year. Weekly or monthly granularity makes the trend easier to see.
Why do my table totals not match the chart?
Chart data is aggregated by property, and table data is aggregated by the dimension you choose, so small differences are normal. Filtering by query or page can also change totals because anonymized queries are omitted. Judge the direction and size of a change, not the exact digits.
Should I trust average position?
Use it as a rough guide only. Google’s debugging guide says not to focus too much on absolute position, because impressions and clicks are the measure of success, and one average can hide large movement on a few important searches. Check position for specific pages or queries instead of the site-wide number.
How do I know if a drop is seasonal?
Look at the 16-month view and see whether the same shape appears a year earlier, then check the affected queries in Google Trends. Google’s debugging guide recommends both steps. If the dip repeats every year, the calendar is the likelier cause.
How fresh is Search Console data?
The newest data can be preliminary, shown as a dotted line, and may change in the next few hours. For a drop analysis, avoid relying on the last day or two and compare complete periods instead.
Does Search Console show calls from my Google Business Profile?
No. Search Console reports on how your website performs in Google Search results, while your Google Business Profile reports its own performance separately. If calls fell and Search Console looks steady, start with our guide to why a Google Business Profile is not showing up.
Conclusion
A Search Console traffic drop looks alarming until you read it in order: seasonality first, then equal-period comparisons, then the clicks and impressions pattern, then where the loss sits and who it affects. Most of the value is in the order, because each step removes some explanations before you change anything on the site.
For the bigger picture, including what Google says about core updates and what to review on your pages, read our guide to Google core update recovery. If you would like a plain-language read of your own Search Console data, Lorphic’s free consultation is a good place to start, and our search engine optimization services cover ongoing monitoring.
Curated by Lorphic
Digital intelligence. Clarity. Truth.