

Numbers from the lab and numbers from your invoice are two different conversations. Gemini 4 Argon has both, and neither is simple.
Google published 19 benchmarks in the launch announcement, Argon leads 13 of them and ties for first on another, and the wins and losses cluster in ways that are actually more informative than a clean sweep would be. Meanwhile, the introductory price of $2 per million input tokens doubles once the introductory period ends, and there’s still no public model ID to try.
This is the benchmark and comparison post for the Gemini 4 Argon cluster. If you’re looking for the feature and capability breakdown, that’s in the overview post. Here, we’re going strictly into numbers: what Argon leads, what it doesn’t, how the per-task economics look, and what all of it says about where Argon may fit across different workloads.
The Full Published Benchmark Table
All figures below are from Google’s official September 30, 2026 announcement and DataCamp’s coverage of the same. Every number is either Google’s own published evaluation or drawn directly from the comparable scores Google published for the other models in context.
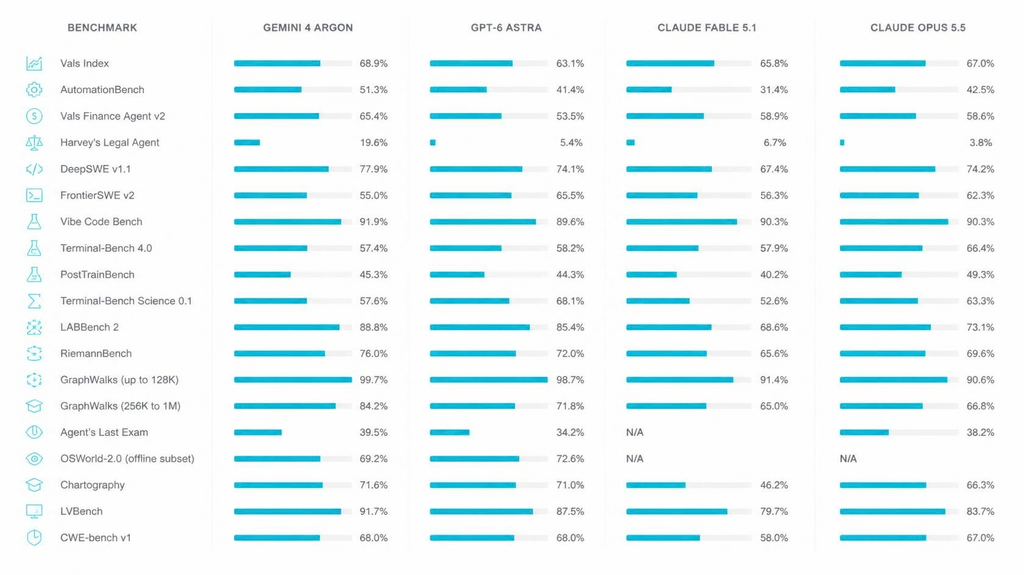
None of these scores have been independently reproduced by external researchers as of the announcement date. That’s not a dismissal of the results. It’s the accurate epistemic state of any frontier model launch, and it matters for how you act on this data.
| Benchmark | Gemini 4 Argon | GPT-6 Astra | Claude Fable 5.1 | Claude Opus 5.5 |
|---|---|---|---|---|
| Vals Index | 68.9% | 63.1% | 65.8% | 67.0% |
| AutomationBench | 51.3% | 41.4% | 31.4% | 42.5% |
| Vals Finance Agent v2 | 65.4% | 53.5% | 58.9% | 58.6% |
| Harvey’s Legal Agent | 19.6% | 5.4% | 6.7% | 3.8% |
| DeepSWE v1.1 | 77.9% | 74.1% | 67.4% | 74.2% |
| FrontierSWE v2 | 55.0% | 65.5% | 56.3% | 62.3% |
| Vibe Code Bench | 91.9% | 89.6% | 90.3% | 90.3% |
| Terminal-Bench 4.0 | 57.4% | 58.2% | 57.9% | 66.4% |
| PostTrainBench | 45.3% | 44.3% | 40.2% | 49.3% |
| Terminal-Bench Science 0.1 | 57.6% | 68.1% | 52.6% | 63.3% |
| LABBench 2 | 88.8% | 85.4% | 68.6% | 73.1% |
| RiemannBench | 76.0% | 72.0% | 65.6% | 69.6% |
| GraphWalks (up to 128K) | 99.7% | 98.7% | 91.4% | 90.6% |
| GraphWalks (256K to 1M) | 84.2% | 71.8% | 65.0% | 66.8% |
| Agent’s Last Exam | 39.5% | 34.2% | N/A | 38.2% |
| OSWorld-2.0 (offline subset) | 69.2% | 72.6% | N/A | N/A |
| Chartography | 71.6% | 71.0% | 46.2% | 66.3% |
| LVBench | 91.7% | 87.5% | 79.7% | 83.7% |
| CWE-bench v1 | 68.0% | 68.0% | 58.0% | 67.0% |
Reading the Wins: What Argon Is Actually Better At
Enterprise knowledge work, and it’s not close in some places
The Vals Index result is the headline: 68.9% for Argon versus 63.1% for GPT-6 Astra, 65.8% for Fable 5.1, 67.0% for Opus 5.5. A 1.9-point lead over the second-placed model (Opus 5.5) looks thin until you look at the domain breakdowns.
Vals Finance Agent v2 measures multi-step financial research. Argon at 65.4% versus 58.9% for Fable 5.1 and 53.5% for Astra is a 6.5-point and 11.9-point lead respectively. AutomationBench, Zapier’s benchmark for end-to-end execution across core business functions, gives Argon 51.3% against 42.5% for Opus 5.5 and 41.4% for Astra. Those are meaningful margins on tasks that actually touch business systems rather than just generating plausible text.
Harvey’s Legal Agent Benchmark is where the most extreme margin is. Argon: 19.6%. Fable 5.1: 6.7%. Astra: 5.4%. Opus 5.5: 3.8%. Every model is failing most of this benchmark, so this is a relative signal: Argon is substantially better at legal research and drafting than anything else published, not a model you’d trust with unsupervised contract drafting.
Long context by a meaningful margin
The GraphWalks result at the 256K to 1M token range is the clearest single number in the whole table. Argon scores 84.2% versus Astra at 71.8%, Fable 5.1 at 65.0%, and Opus 5.5 at 66.8%. Argon’s 12.4-point lead over Astra at that range is the largest gap between the two models on any benchmark in the table. The result is relevant to workloads where reliable retrieval across very long inputs matters, although the benchmark does not by itself establish production performance on entire repositories or legal records.
At shorter context (up to 128K), everyone is high: Argon leads at 99.7% but Astra is at 98.7%. The gap only opens at scale.
Real-world software engineering: DeepSWE
DeepSWE v1.1 at 77.9% is Argon’s strongest coding result. Ahead of Opus 5.5 at 74.2%, Astra at 74.1%, and Fable 5.1 at 67.4%. This benchmark is relevant for the class of work Google is positioning Argon for: long-horizon tasks against real repositories rather than synthetic coding puzzles.
Science and math (with caveats)
LABBench 2 gives Argon 88.8% versus Astra’s 85.4%. RiemannBench gives it 76.0% versus Astra’s 72.0%. Both strong. Both contrast with the Terminal-Bench Science 0.1 loss, which measures science tasks executed through a terminal. The distinction between reasoning about scientific problems and executing them through a shell appears to be where Argon’s advantage breaks down.
Reading the Losses: Where Argon Falls Behind
Google published these, which is worth noting explicitly. Hiding losses is easy. These are in the announcement.
FrontierSWE v2: 10.5 points behind Astra
Argon: 55.0%. Astra: 65.5%. Opus 5.5: 62.3%. Argon trails on FrontierSWE v2 by 10.5 points against Astra and 7.3 points against Opus 5.5. Per DataCamp’s analysis of the published pattern: Argon’s scores are higher on several knowledge-work and long-context evaluations, while Astra and Opus 5.5 score higher on several terminal-driven evaluations, including FrontierSWE v2 and Terminal-Bench 4.0.
For developers evaluating Argon for agentic coding, this loss matters specifically for the kind of terminal-heavy debugging and multi-command execution loops that constitute a large fraction of day-to-day engineering work.
Terminal-Bench 4.0: 9 points behind Opus 5.5
Argon: 57.4%. Opus 5.5: 66.4%. Astra: 58.2%. Per DataCamp’s coverage, Claude Sonnet 5.5, a mid-tier model, scores 70.6% on the same benchmark, which means Argon trails a model priced well below it on terminal-driven agent work. That’s the kind of specific data point that belongs in a decision about which model to run for a CI/CD agent or a developer assistant.
Terminal-Bench Science 0.1: 10.5 points behind Astra
Argon: 57.6%. Astra: 68.1%. Astra scores higher by 10.5 points on this evaluation as well, consistent with the FrontierSWE v2 gap.
OSWorld-2.0 and PostTrainBench
Argon at 69.2% versus Astra at 72.6% on OSWorld-2.0 is a smaller gap than the terminal benchmarks but in the same direction. PostTrainBench, measuring ML engineering tasks, gives Argon 45.3% versus Opus 5.5’s 49.3%.
Gemini 4 Argon vs GPT-6 Astra: The Core Comparison
The published results suggest different strengths across these workloads. Argon’s scores are higher on several knowledge-work and long-context evaluations. Astra scores higher on FrontierSWE v2 and Terminal-Bench Science 0.1.
| Dimension | Argon wins | Astra wins |
|---|---|---|
| Enterprise knowledge work (Vals, Finance, Legal, AutomationBench) | Yes, by meaningful margins | |
| Long context (GraphWalks 256K to 1M) | 84.2% vs 71.8% | |
| DeepSWE v1.1 | 77.9% vs 74.1% | |
| Long video understanding (LVBench) | 91.7% vs 87.5% | |
| Science/math (LABBench, Riemann) | Yes | |
| FrontierSWE v2 (harder SWE) | 65.5% vs 55.0% | |
| Terminal-Bench Science 0.1 | 68.1% vs 57.6% | |
| OSWorld-2.0 | 72.6% vs 69.2% |
Pricing (introductory): Both are $2 input, $10 output per million tokens. Identical at launch.
Pricing (standard, post-introductory): Argon rises to $4/$20. Astra’s standard rate is $10/$50. At the published standard rates, Argon’s $4/$20 pricing is lower than Astra’s $10/$50 pricing, working out to 2.5× lower per-token pricing.
Gemini 4 Argon vs Claude Opus 5.5
The most directly relevant comparison for teams currently using Claude, since Opus 5.5 launched the week before Argon.
Argon’s published scores are higher on knowledge work, long context, and DeepSWE. Opus 5.5 scores higher than Argon on Terminal-Bench 4.0 and FrontierSWE v2. At standard post-introductory rates they land at the same price ($4/$20).
| Dimension | Argon | Opus 5.5 |
|---|---|---|
| Vals Index | 68.9% | 67.0% |
| AutomationBench | 51.3% | 42.5% |
| Harvey’s Legal | 19.6% | 3.8% |
| DeepSWE v1.1 | 77.9% | 74.2% |
| GraphWalks 256K to 1M | 84.2% | 66.8% |
| LVBench | 91.7% | 83.7% |
| Terminal-Bench 4.0 | 57.4% | 66.4% |
| FrontierSWE v2 | 55.0% | 62.3% |
| PostTrainBench | 45.3% | 49.3% |
| Standard API price | $4 input / $20 output | $4 input / $20 output |
Because the post-introductory token pricing is identical, differences in benchmark performance and actual task costs may become more important when comparing the two.
Gemini 4 Argon vs Claude Fable 5.1
Against Argon, Fable 5.1 trails on the published comparison set, with the clearest differences appearing in knowledge work and long-context evaluations. Claude Opus 5.5 is a more relevant comparison for most teams because it’s more broadly available and at the same price post-introductory period.
The Pricing Math: What It Actually Costs Per Task
Raw per-token pricing hides the real cost. DataCamp’s Argon coverage made a point worth quoting directly: in their coverage of GPT-6.1 Sol, they recorded $23.80 per Terminal-Bench Science 0.1 task for GPT-6 Astra versus $5.47 for Sol. Same benchmark, very different invoices.
Google has not published per-task costs for Argon, and without a public model ID to test against, no external researcher has either.
The key variables for estimating Argon’s actual cost per task:
Introductory pricing: $2 per million input tokens, $10 per million output tokens. Cached input at 95% off input rate (so $0.10 per million). Duration of introductory period not published. Budget for the $4/$20 standard rate on anything expected to outlive a short pilot.
Standard pricing: $4 per million input, $20 per million output. At this rate, Argon matches Claude Opus 5.5’s standard pricing exactly.
The 1M output limit changes the per-task math for long runs. A task that would previously require multiple prompted sessions (each paying for re-sent context) can potentially be completed in one pass. Whether that reduces or increases total cost depends on how much thinking the model does per generation. Long reasoning traces at $20 per million output tokens are expensive. Google has not clarified whether reasoning tokens bill at the output rate.
Agentic workflow cost accumulation. Every step of a multi-turn agent session re-sends growing context as input. At $4 per million standard input, a session with substantial context growth can exceed the token price comparison significantly. This applies to all frontier models and is not specific to Argon.
What the Pattern in the Benchmarks Is Actually Telling You
Reading across the 19 benchmarks, the published results point to different strengths. Argon’s scores are higher on several long-context and knowledge-work evaluations. Astra and Opus 5.5 score higher on several terminal-driven evaluations.
For workloads like reading a legal filing and drafting a response, analyzing a financial model across multiple documents, or running a multi-step research workflow that requires reasoning over a long context, Argon’s published numbers are higher than the comparison set.
For workloads like a CI/CD agent that executes commands, a developer assistant that debugs through the terminal, or scientific tasks executed through a shell, Astra and Opus 5.5 score higher on several of the published terminal-driven evaluations, including FrontierSWE v2 and Terminal-Bench 4.0.
Frequently Asked Questions
What benchmarks does Gemini 4 Argon lead on?
Per Google’s published results, Argon leads on Vals Index (68.9%), AutomationBench (51.3%), Vals Finance Agent v2 (65.4%), Harvey’s Legal Agent Benchmark (19.6%), DeepSWE v1.1 (77.9%), Vibe Code Bench (91.9%), GraphWalks at long context (84.2%), LVBench (91.7%), LABBench 2 (88.8%), RiemannBench (76.0%), Chartography (71.6%), Agent’s Last Exam (39.5%), and ties CWE-bench v1 at 68%.
Where does Gemini 4 Argon fall behind?
Per Google’s own published benchmarks, Argon trails GPT-6 Astra on FrontierSWE v2 (55.0% vs 65.5%) and Terminal-Bench Science 0.1 (57.6% vs 68.1%), and trails Claude Opus 5.5 on Terminal-Bench 4.0 (57.4% vs 66.4%) and PostTrainBench (45.3% vs 49.3%).
Is Gemini 4 Argon better than GPT-6 Astra?
On knowledge work and long-context tasks, Argon’s published scores are ahead. On terminal-driven science and software engineering execution, Astra’s published scores are ahead. The introductory pricing is identical; standard rates favor Argon. Neither result is independently verified as of September 30, 2026.
Is Gemini 4 Argon better than Claude Opus 5.5?
Argon leads on enterprise knowledge work, long context, and DeepSWE. Opus 5.5 leads on terminal-driven agent benchmarks. Standard API pricing post-promo is identical ($4/$20). Argon’s 1M output limit is a structural advantage for very long single-pass tasks. Choice depends on use case.
Are the Gemini 4 Argon benchmark scores independently verified?
No. As of September 30, 2026, all Argon scores come from Google’s own published evaluation results. No external researcher had independently reproduced any score on standard public leaderboards at the time of the announcement.
How does Gemini 4 Argon perform on coding benchmarks?
DeepSWE v1.1: 77.9% (state of the art per Google’s published results). FrontierSWE v2: 55.0% (behind Astra and Opus 5.5). Vibe Code Bench: 91.9% (leads by a small margin). Terminal-Bench 4.0: 57.4% (trails Opus 5.5 by 9 points). The pattern favors Argon for long-horizon repository-level planning and editing, and Astra/Opus 5.5 for terminal execution.
How does Gemini 4 Argon perform on reasoning benchmarks?
Strong on science and math: LABBench 2 at 88.8%, RiemannBench at 76.0%, Agent’s Last Exam at 39.5%, all leading the published comparison set. Weaker on terminal-executed science tasks (Terminal-Bench Science 0.1: 57.6%).
Final Thoughts
Gemini 4 Argon’s benchmark story is more interesting than either “Argon wins” or “Argon loses” would be. The wins and losses cluster clearly, the pricing is specific, and the caveats are real.
The honest constraint on this analysis is that every number in it is vendor-reported. Independent reproduction takes time. When third-party evaluators publish results on Argon, that’s when the picture will sharpen.
Until independent evaluations are available, the published results point to different strengths: Argon scores higher on several long-context and knowledge-work evaluations, while Astra and Opus 5.5 score higher on several terminal-driven evaluations. And watch the per-task cost rather than the per-token price before committing either to a production agent fleet.
All benchmark scores in this article are from Google’s official Gemini 4 Argon announcement (blog.google, September 30, 2026) and DataCamp’s coverage of the same announcement. No external independent reproduction of any Argon benchmark was available as of publication. Competitor scores as reported by Google in the same announcement materials.
Curated by Lorphic
Digital intelligence. Clarity. Truth.